Margin Management – A New Way of Looking at Your Bar Business
Beverage cost is an industry performance metric owners, asset managers and general managers look to in assessing bar performance. A budget target is set and tracked against in P&L reporting. Whether automated inventory tools or simple excel spreadsheets are utilized, the resulting numbers are generated and woe the beverage operation that is tracking over its budget target.
But a funny thing happens along the way. Numbers jump up and down from one month to the next, often in ways that could not possibly reflect actual improvement in or degradation of performance in the operation. “It must be the accounting, or the inventory process, or an event we had” are some of the usual explanations. An operation with a major improvement opportunity can get celebrated for its success because the numbers are fine or a good operation comes under pressure because the numbers are not. There is no opportunity in the budget process to define what the numbers should be and they often just end up being the same as last year. No process occurs to reflect on what the number should be given all the givens and how changing business mix and purchase costs factors could affect the numbers positively or negatively.
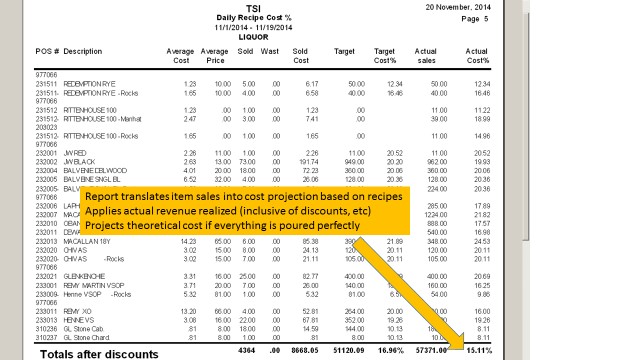 New technology now makes it possible to get those answers. Margin Management tools effectively interfacing with POS systems can deliver the desired information. In the example to the right the system is reporting:
- • This bar operation is running a 15.1% theoretical liquor cost. If everything was poured perfectly in the bar this is what the cost should be.
- • We can also see what the contributing role of every beverage item we sell is on the overall result.
No one would expect every drink to be poured at 1.5oz’s. Bartenders would often pour in a range between 1.5 and 1.8oz’s. A 10% to 20% variance from this number would be considered good. But in this case if you are actually running a 20% liquor cost then you are 33% over your theoretical. Two factors are likely driving the 33% variance:
- • Some drinks are being over poured. A 2oz pour in a 1.5 oz. recipe drink is a 33% variance. A 4oz pour in a 3oz recipe martini is a 33% variance
- • Some drinks are being poured, but not sold. Four drinks poured at 1.5oz with only three drinks sold is a 33% variance.
Another factor that contributes to variance is when drinks are sold without proper up charges. If I pour a ROX drink at 2oz’s (which is my recipe), but I don’t ring the ROX up charge, then I have a 33% variance.
Margin management is the next natural step with this data. A 15.1% theoretical liquor cost is fairly high. Normal targets should be in the 9-12% range. In some markets the market factors are the primary driver for this problem:
- • Higher than normal purchase costs
- • Pervasive low pricing and high standards practices in the market
Higher purchase costs can be validated, but market practices are not as easy to know with certainty. The number one explanation for a 2oz regular drink standard on a $9 Grey Goose is – “everyone else is doing it.” But that is often just not the case. Oftentimes lowering a regular standard from 2oz’s to 1.5oz’s and or increasing base price or up charges for drinks will not result in the feared catastrophic impact on guest counts and guest satisfaction.
What drives a theoretical cost above this range that is controllable?
- • High standards
- • High sales mix in lower margin products
- • Low base prices / up charges and or corrosive promotional programs
A 2oz standard may seem like a great idea to distance an operation from others using the more standard 1.5oz regular drink target. But it increases liquor costs by 33%. That means a 12% liquor cost operation becomes a 16% operation without any change in pricing. Even if drink prices go up $1 – the net effect would still be a 15% theoretical liquor cost operation. Both Reg and ROX drinks now also get the same pour amount and there is no up charge revenue.
 In the example to the right premium liquors have a 2oz recipe. Thus a JW Black has the same cost whether it is ordered with a mixer or up/ROX. At $13 the price is up there, but the theoretical cost (if the drinks is poured perfectly) is at 20%. If the bartender averages 2.4oz on the pours, the actual would be 24%. If we lowered the standard on the non ROX JW Black to 1.5oz’s and then added in a $1 or $2 ROX up charge, theoretical would drop under 15%. And given 73 were sold in this period the volume dictates this item is pulling overall theoretical margin up.
In some cases with super premium products like Balvene Single Barrel you have a tough choice on pricing. In this case at $32 per drink, 11 were sold in this period. A 20% theoretical cost may be right here, because you are generating a lot more overall margin on these sales. But you have to wonder – would the customer paying $32 a drink be upset paying $35 per drink to get this liquor?
When you look at the Rittenhouse 100, we see that a regular drink pour (which has a 1.5oz standard in this case) comes in at 11.2% – the more of this you sell the better your margin % will be. But look at what happens with the ROX modifier – there is no change in sale price (this modifier does not have an upcharge) and the theoretical jumps to 15%. Then when you look at the Manhattan modifier, we see an upcharge of $2 gets applied, but the overall cost increase of $1.25 puts the overall drink margin at 19%. And you sold more manhattans then the other drinks.
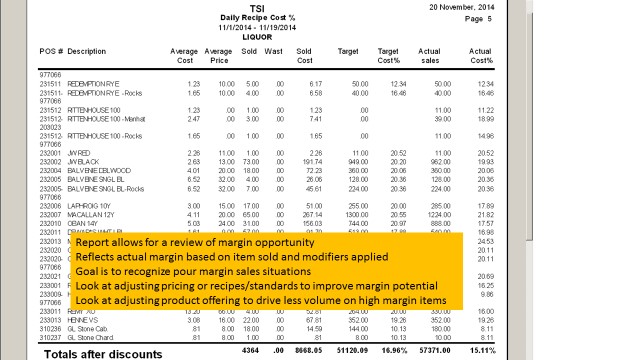
The process of margin management is to look at the reports and spotlight situations where you can:
- • Change your standard to get a better starting point for theoretical cost
- • Adjust your base prices on higher volume drinks which have a higher theoretical cost
- • Adjust your up charges or set up tiered up charges (call and premium) such that you hold margin position with the bigger recipe pour
- • Add products (i.e. specialty cocktails) which pull volume down on high volume / lower margin items. For instance if Grey Goose has a poor margin profile, then multiple vodka type cocktails using higher margin brands can lower Grey Goose volume and lower beverage cost results.